Sunday, December 7, 2008


Propoganda maps can be a powerful tool in persuading others to your views.


DLG


A Digital Line Graph (DLG) is digital vector data representing cartographic information.

DLG shown in red and blue lines.


DEM


A digital elevation model (DEM) is a digital representation of ground surface topography or terrain. It is also widely known as a digital terrain model (DTM). A DEM can be represented as a raster (a grid of squares) or as a triangular irregular network. DEMs are commonly built using remote sensing techniques, however, they may also be built from land surveying. DEMs are used often in geographic information systems, and are the most common basis for digitally-produced relief maps.

DRG


A digital raster graphic (DRG) is a digital image resulting from scanning a paper USGS topographic map for use on a computer. DRGs created by USGS are typically scanned at 250 dpi and saved as a TIFF. The raster image usually includes the original border information, referred to as the "map collar". The map file is UTM projected and georeferenced to the surface of the earth. DRG's are regularly used in GIS applications.


In a classed choropleth map, areal units are combined into a smaller number of groups and portrayed in intervals. There are 6 classification levels in this classed choropleth map.

DOQQ


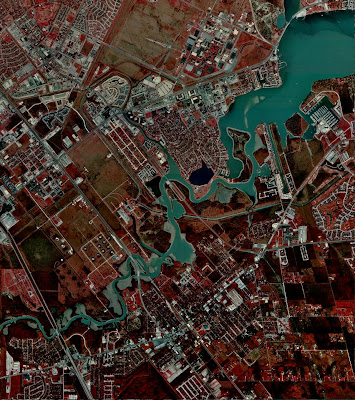
A DOQQ is a one meter pixel resolution that covers areas measuring 3.75-minutes longitude and latitude at a 1:12,000 scale. Currently, 3.75-minute DOQQs are available for most of the United States, and the remaining locations should have been completed by 2004.


Isopleths


Isopleths , or contour line, is a feature of meteorological charts, connecting points which have an equal value of some variable at a given time and spatial area. The particular variables shown on a given chart may include values such as pressure, temperature, wind speed, etc. They are used to assist in visualizing the general features of a meteorological "field".